ASSET MANAGEMENT SYSTEM · BY SORIGIN

Run your entire renewable fleet from one cockpit.

One intelligence layer across solar, wind, battery and hybrid — turning live telemetry into decisions before performance slips. No silos. No guesswork.

600+
MW under intelligence
4
asset classes, one layer
24/7
live command center
Vendor-agnostic · multi-OEM · built for utility-scale, multi-site portfolios
FLEET · LIVE
42 assets · 6 sites
SOLAR
312 MW
WIND
175 MW
STORAGE
84 %
Availability99.2%
vs forecast+4.1%
1 predictive alert
WTG-07 gearbox · 14 days
One platform for every asset class Solar Wind Battery (BESS) Hybrid
The intelligence layer

Everything your O&M team needs

One source of truth that turns raw telemetry into operational decisions.
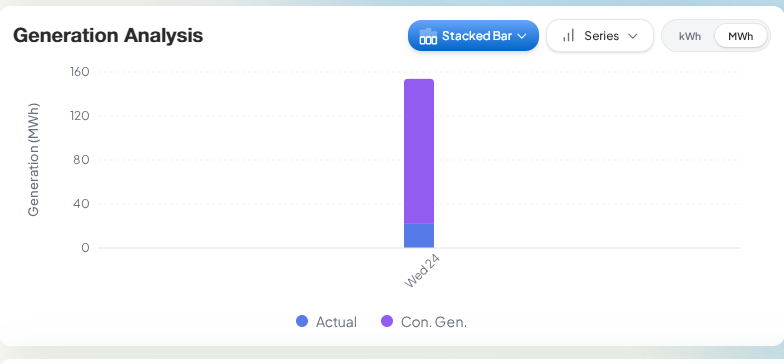
Real-time monitoring 42 live
Generation Analysis
Analytics & benchmarking PR 84.6%
Asset Performance Overview
Predictive maintenance 1 alert
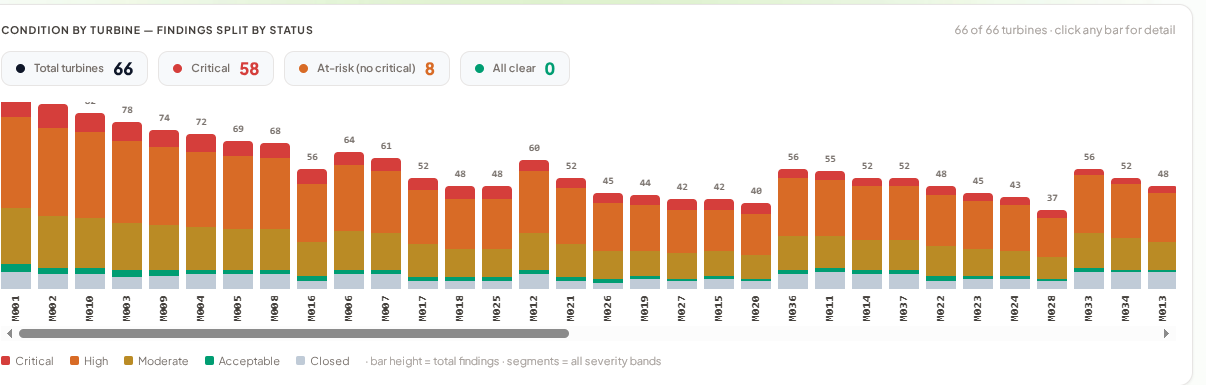
Condition by turbine — findings split by status
AMS intelligence engine +$2.6M
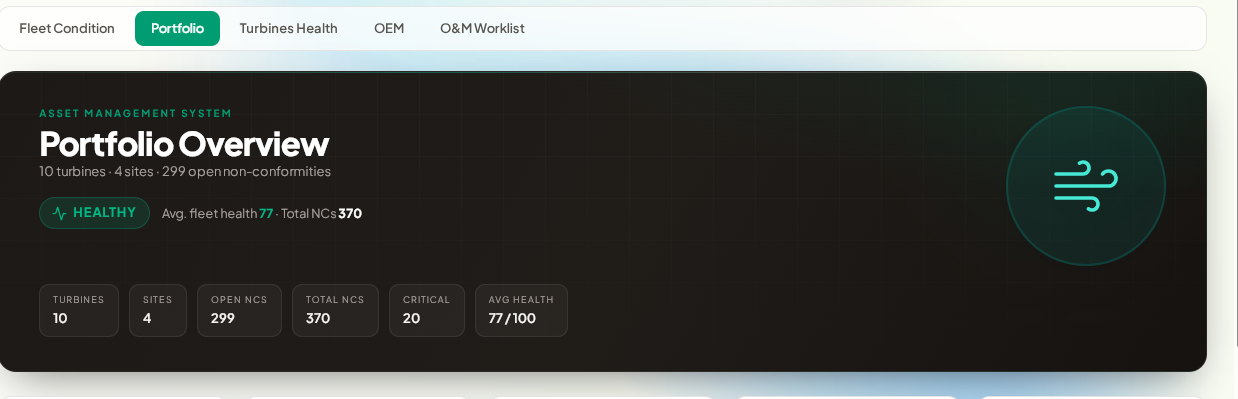
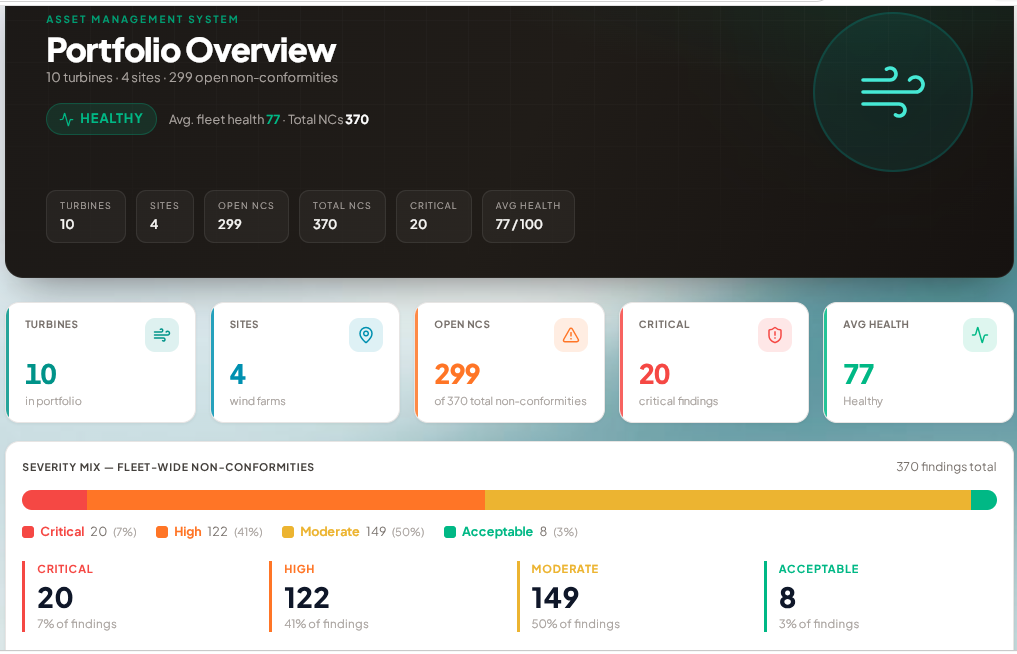
Portfolio Overview
Digital Twin WT-127
LIVE
Live site feed
Turbine Health
Excellent
96/100
Live Parameters
Wind Speed7.2 m/s
Power Output2.1 MW
RPM14.5
Temperature47 °C
Status
Online
Last Updated
1:10 PM
Power Output
2.1 MW
Wind Speed
7.2 m/s
How it works

From data to decisions, in five stages

Watch the loop — or tap any stage — to see the real AMS portal at each step.

AMS OPTIMIZATION LOOP
Monitor
Analyze
Predict
Optimize
Maximize
Platform modules

Every module your operation runs on

AI & Intelligence

A window into the intelligence

The intelligence platform opens a window onto Sorigin's AI & data-science layer — the models read your telemetry, find the root cause, and write the analysis your team would otherwise build by hand.

AMS
Asset data & health
OMS
Operations & work orders
Working together
AMS and OMS share one intelligence layer — health signals become predictive maintenance tasks, active alarms become work orders, and every closure feeds the models that train on your history.
What powers the intelligence platform
Smart breakdown insights
Top cost driver, longest downtime, MTBF and repeat offenders — the few issues that drive most of your losses, surfaced automatically.
Root-cause attribution
Every finding grouped by turbine zone and attributed to a responsible party — warranty-recoverable OEM defects separated from operational issues.
Active alarms & safety NCs
Safety-affecting non-conformances flagged for immediate action, per turbine, with the legal-exposure note attached.
Models trained on history
Years of historical data continuously train the models, amplifying performance the longer you run.
Market-ready KPIs
PR, availability and capacity factor — standardized, audited and ready to report.
Automated reports & auditing
Scheduled reports and a complete audit trail, generated without a single spreadsheet.
The AMS portal

This is what your team logs into

Real screens from the AMS portal — performance, daily reports, fleet condition and portfolio. Switch between them, or let it cycle.
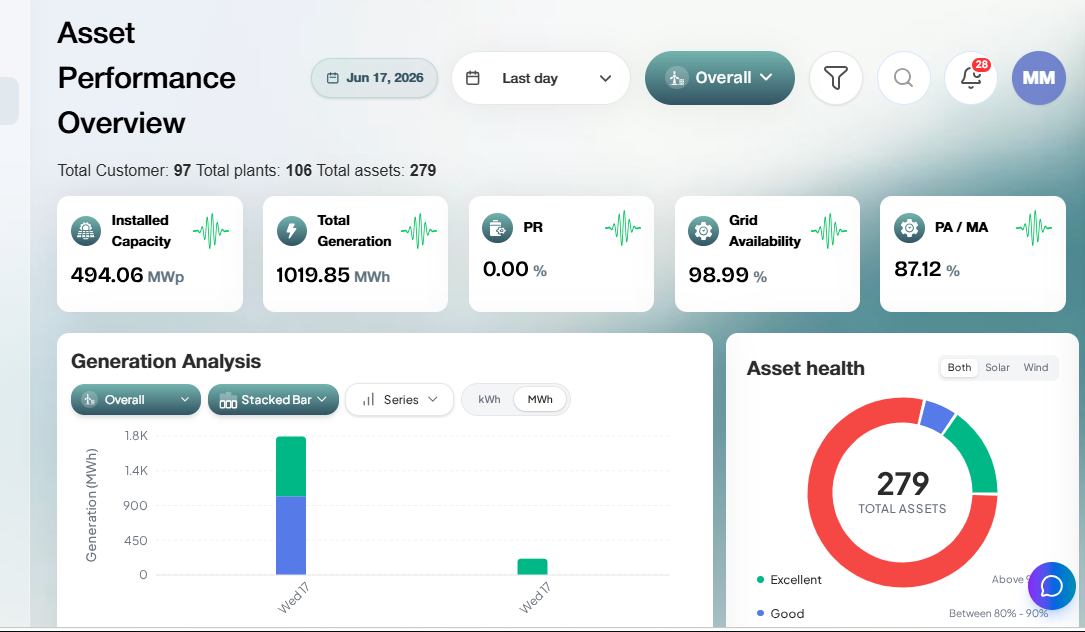
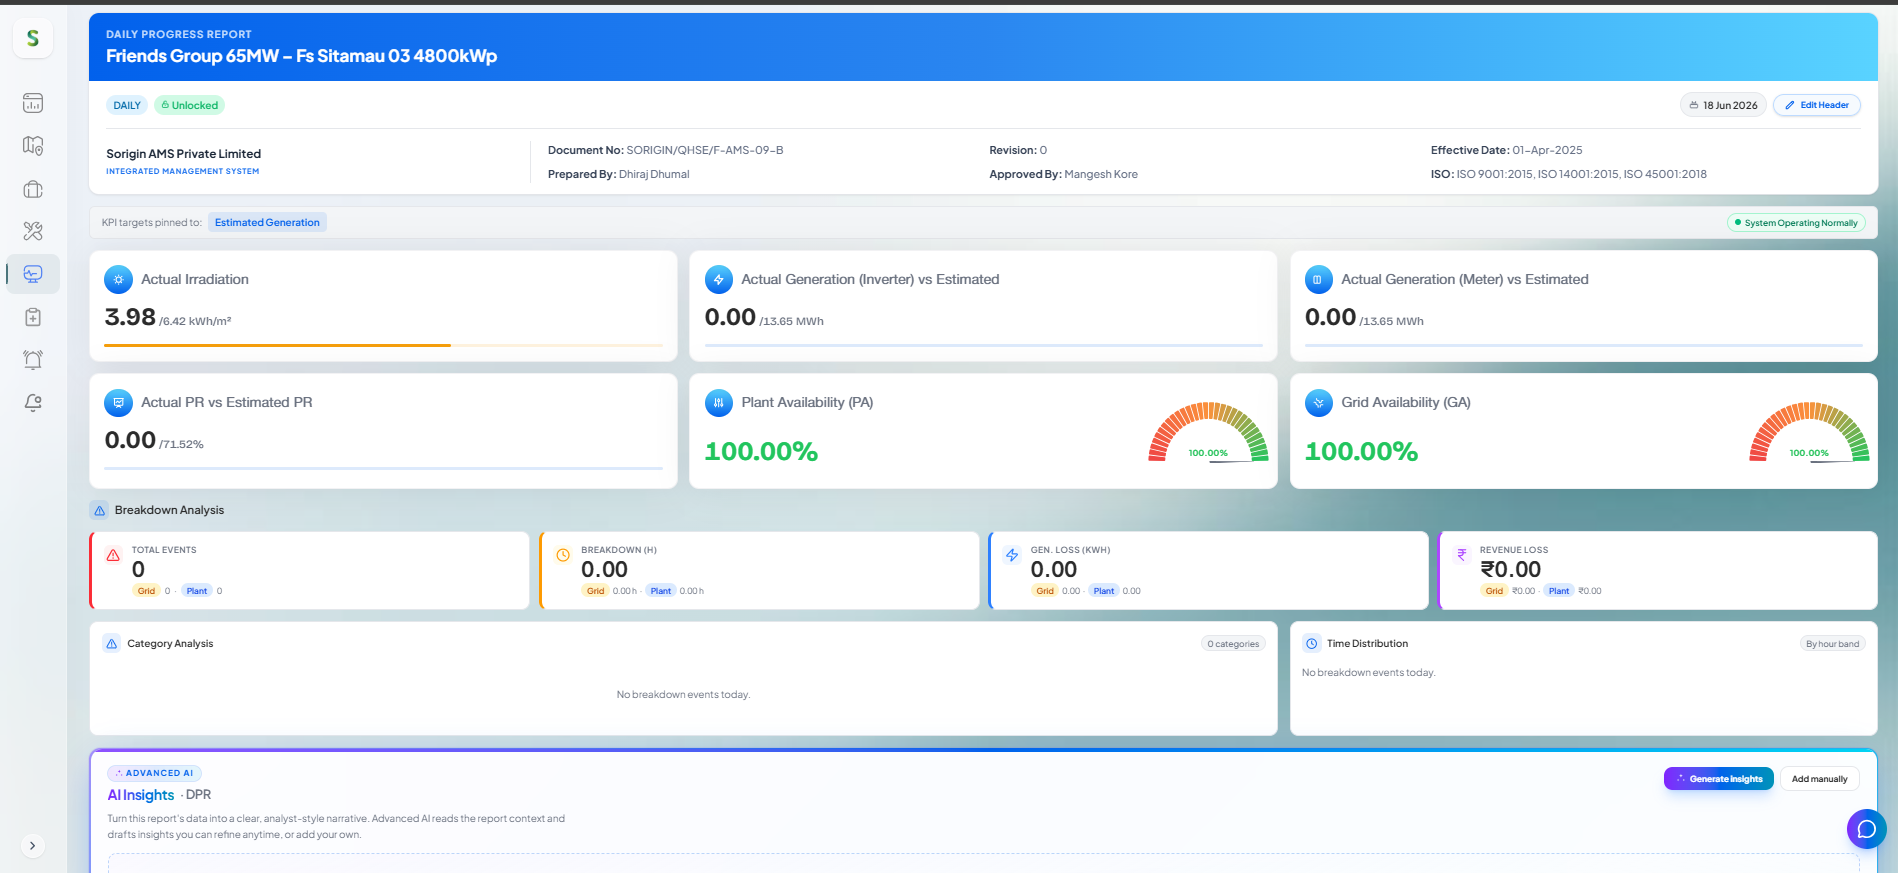
🔒 ams.sorigin.app/dashboard/performance
Asset Performance Overview
Daily Progress Report
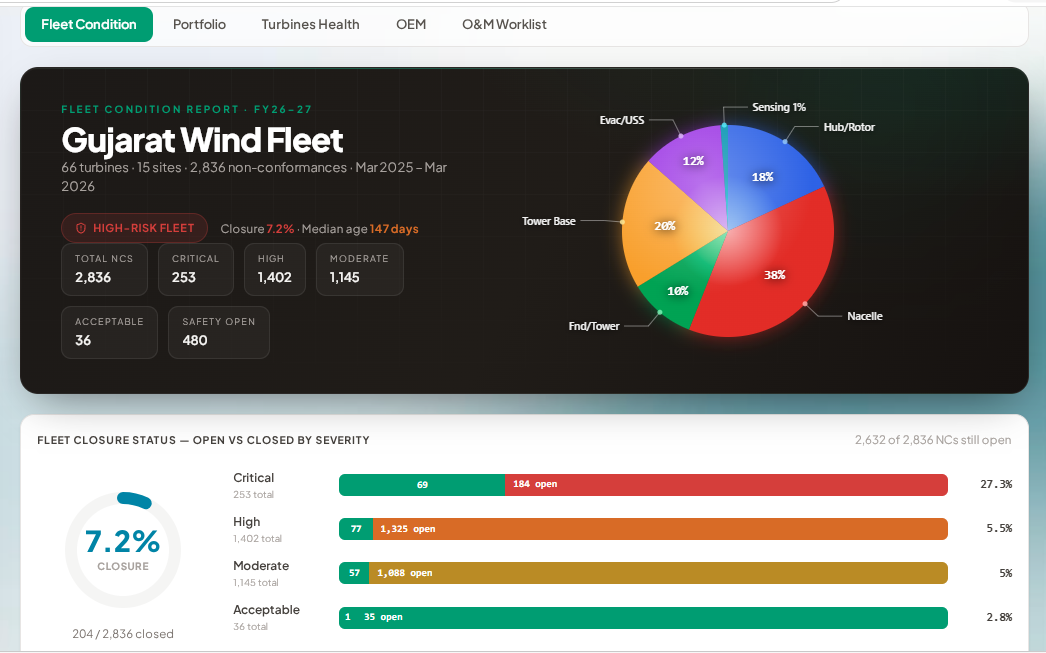
Fleet Condition Report
Portfolio Overview
AI insights

Your fleet, explained in plain English

AMS reads every signal across the fleet and writes the analysis for you — what changed, why it happened, and the actions that recover the most yield.
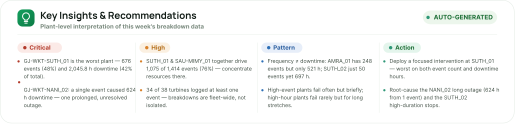
AI-written summaries
Every period, AMS reads the fleet telemetry and writes a plain-English summary of what changed and why — no analyst required.
Ranked recommendations
It surfaces the highest-impact actions first, so your team knows exactly what to fix to recover the most yield.
✦ AUTO-GENERATED BY AMS AI
AI key insights & recommendations
On the go

Your whole fleet, in your pocket

The full AMS command center, on mobile. Track generation, revenue and asset health — and act on alerts — wherever you are.

Live at a glance
Generation, revenue and availability across the whole portfolio.
Alerts that travel with you
Push notifications the moment an asset deviates from plan.
Weekly & monthly KPI trends
Spot performance shifts per site, right from the home screen.
iOS Android
Measurable impact

Operational impact you can measure

100%
Asset visibility
30%
Faster issue resolution
20%
Reduced downtime
6.2M
Data points / day
Before vs after AMS

From fragmented to intelligent

Manual operations on the left, a fully digitalised fleet on the right — drag the handle, or let it sweep.

WITH AMS · DIGITAL
WITHOUT AMS · MANUAL
Manual reporting
Excel & scattered files
No on-ground history
Manual comms
Fragmented tools
Reactive fixes
100% visibility
Live centralized data
Automated reports
Active alarms
Predictive AI ops
Full audit trail
Enterprise scale

Built for utility-scale renewable portfolios

From a single asset to an enterprise fleet — AMS scales across technologies, geographies, and ownership structures.

Solar
Utility PV, rooftop & tracker portfolios with string-level depth.
Wind
Onshore farms with turbine-level SCADA & component health.
Battery
BESS state-of-health, cycling & dispatch optimization.
Hybrid
Co-located solar + wind + storage as one optimized system.
Single asset
→→→
Enterprise fleet
1 → ∞
assets
Multi-site
geographies
Role-based
access

Ready to optimize your fleet?

See how AMS turns renewable assets into intelligent assets — maximizing performance, reliability, and portfolio value.